
To manage Time and Action (T&A) Calendar at the garment pre-production stage, organizations use basic tools – from spreadsheet to specialized T&A modules available in several enterprises and PLM solutions. While spreadsheet offers basic data management only, the specialized module turns out to be a costly proposition. As an alternate, a freeware instead can give necessary features at zero cost. Divya Soni, Master of Fashion Technology (M.F.T) student, NIFT Delhi and Dr. Prabir Jana, NIFT Delhi explore the feasibility of web-based software for planning and tracking T&A effectively in lesser time and how its features can solve the problems faced by the merchandisers.
Background
Excel sheets are often used by production executives in apparel manufacturing to manage Time and Action Calendar (T&A). Processes are executed according to the plan made, but sometimes there is a delay in certain tasks which necessitates rescheduling so that the other processes do not get affected. It is difficult to manage these changes in excel sheets and word files as they do not update automatically. Moreover, the static excel sheets do not generate ‘to-do lists’, neither they facilitate resource allocation, nor allow for flexible calendars (i.e., working hours cannot be modified and holidays cannot be defined) or generate alerts or pre-inform about the delay that is going to happen during tasks. Also, they are incapable of visually representing the plan with dates through Gantt Charts. Being mere tables with time duration outlined for each milestone event, the excel sheets rarely assist streamlined execution of the plan.
Although T&A Calendars are actually based on the same logic as PERT/CPM network, often the apparel-specific T&A modules available with various ERP or PLM solutions simplify the T&A Calendar to a linear one and do not accommodate parallel activities. This situation can be resolved with the help of a Project Management Software.
Why Project Management Software for T&A Calendar?
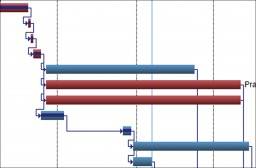
Once the delivery date of the order and the interdependence between different tasks are defined, Gantt Chart can be generated automatically through the Project Management Software. Also, whenever duration of any task is changed or any dependency relation is changed, a computerized Gantt Chart can incorporate the changes automatically, keeping other parameters intact. Computerized Gantt Chart indicates the critical path in red colour, and automatically shows the earliest start date for individual tasks. Once the executives responsible for each task are defined, Gantt Chart software can calculate resource (human) utilization across multiple orders.
When the follow-up for a particular order commences, Gantt Chart software can show the planned and actual dates of tasks, and calculate delay analysis dynamically. Since the planned duration and sequence of activities decide the critical path, and if during actual execution of order, duration of a non-critical activity stretches beyond the planned duration, then it may become a critical activity and alter the critical path accordingly. This happens frequently during order execution and therefore specialized software is necessary for tracking T&A Calendar which automatically and dynamically changes the critical path during order execution process.
Project Management Software serves adeptly to these vagaries of a T&A Calendar due to its various scientific and visual features such as:
1. Creating Gantt Charts: Gantt Chart shows the actual duration and interdependencies of different merchandising activities in a time scale. This helps to visualize which activity takes how much time, and precede and succeed which activity.
2. Ability to visualize the critical path in different colours: Gantt Chart is made up of critical (activities which should be completed on time) and non-critical activities. This classification of activities highlights that delays in critical activities will delay the whole process; however delay in non-critical activities may not delay the whole process. Colour coding the critical activities helps the merchandiser dedicate special attention to critical activities and meet deadlines.
3. Saving plan and Gantt Chart in PDF format: Gantt charts and tables generated by the software can be converted into .pdf file format, which can be printed to see the entire plan in hard copy.
4. Generating ‘To Do List’ and Availability of Resources: ‘To Do List’ shows the tasks to be done by each resource separately with respect to a particular order. This helps ascertain the workload of each resource.
5. Option of Dependency (finish to start, start to start, finish to finish and fixed finish): Relations between tasks such as, starting a task after completion of first, finishing of two tasks together, etc. can be established which help save time.
For example, a particular order needs 5 days for cutting, and sewing needs cut pieces to start. So sewing can be started after one day of cutting has begun, which will save time, and the software identifies these possibilities.
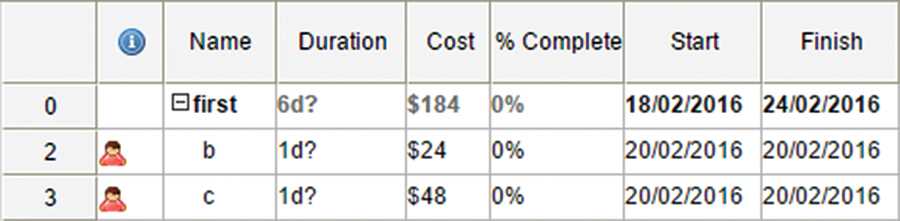
6. Possibility of showing cost per operation: The software can calculate costs for each task, and subsequently do the order costing.
7. Option for resource levelling: The software can detect and highlight situations where there is over-utilization of resources, i.e. resource is allocated for more than the working hours (let’s say 8 hours) or a single resource is doing more than one task at a time, which is not possible. The software levels it and reschedules the activities so that there are no clashes.
8. Ability to show planned date, actual date, and delay details: The software suggests the date of commencement of projects by backward tracking from the deadline. The software also reviews the date of commencement inputs by the user to assess if the project will be finished in time.
9. Flexible calendar: The software’s calendar can be modified to change working days, convert the lead time to hours, and even incorporate holidays. The calendar also accommodates the minute details of the daily work schedule such as discounting lunch time from the total time available.
10. Able to show milestones separately: While merchandisers monitor the progress at micro-level activities, the higher level managers/directors and buying offices monitor macro-level activities, also known as milestones, to assess the degree of order completion.
11. Multiple tasks can be assigned in single operation: Some operations have sub-tasks. This software helps define sub-tasks under parent task. For example, if sample making is the parent activity; under that pattern making, sample cutting, embroidery, sample sewing, quality checking, finishing, and sample packing will be the sub-activities.
12. Percentage of work completed: The task-wise monitoring of the order can be customized to quantify the percentage of work completed to keep a track of how many tasks have been completed and how much work is still left.
13. Task-wise colour coding: Similar types of tasks can be grouped and colour coded. This feature comes handy in a variety of situations such as grouping activities being handled by one person or grouping activities in order of importance.
Solutions Available
The Project Management Software can be desktop-based or web-based, and paid or free. Keeping total cost of ownership of any small and medium organization in mind, features of Gantter have been compared with other web-based software packages.
After comparing software according to the parameters selected, Gantter was chosen for a pilot run in a company to check its feasibility and to get feedbacks about the software from other small-scale garment manufacturing industries.
Pilot implementation of Gantter freeware
Being a web-based Project Management Software, Gantter does not require installation on any device. It runs directly on the browser (like any other email portal). Since, it is not device-dependent, saved files can be accessed on any device from anywhere. The software gets updated automatically whenever any update for the software is released.
Factors that need to be considered while preparing a T&A Calendar:
1. Production capacity of plant
2. Style type of merchandise
3. Festivals of manufacturing country
4. Holidays
5. Shipment details
6. Festivals of country from where raw material is imported
7. Logistics facilities
8. Lead time estimated by buyer
9. Style complications
10. Fabric and trims manufacturing complications
11. Buffer required from each department
12. Response time from buyer at different stages
The data entry to the software can be done in six simple steps:
1. List down the activities of the style with duration
2. Create dependencies among tasks (finish to finish, start to start, start to finish and finish to start)
3. Preparing the Gantt Chart (which is done automatically on Gantter)
4. Modify the calendar according to company rules (for different holidays or working times)
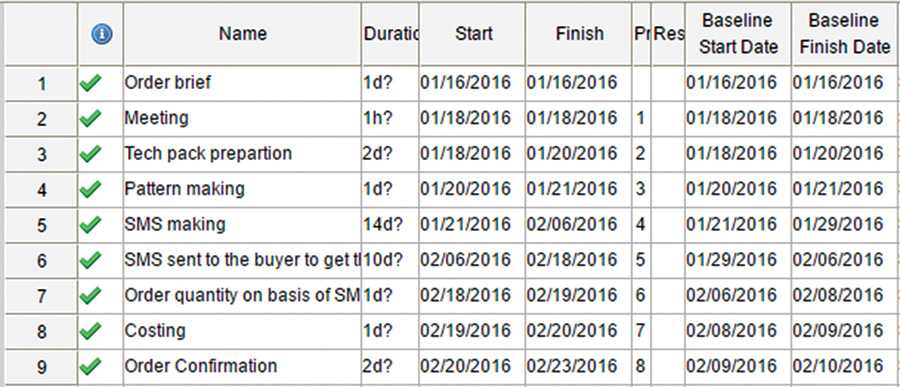
5. Add baseline
6. Give title to the file and save it to Google Drive.
The software also consists of a very interactive feature, i.e. multi-user collaboration which will help the users to work with their co-members sitting in different locations. This software is able to show Gantt Chart with calendar dates for each and every activity. This will help in predicting the end date and start date of the project. All the files are directly stored in Google Drive and therefore can be opened on any device. Changes done are directly stored in the drive and are automatically updated in every file shared, which means everyone will be able to see the updated file. Resource allocation is done at the planning stage, which will reduce the time wasted in allocating operators to tasks on the spot which cause chaos.
This software also detects the over-allocation of resources, and the feature of auto-levelling of resources ensures optimal utilization of resources while assuring zero ambiguity during allocation. It generates sharable links; percentage completion can be filled and costs can be calculated as well.
Apart from comparing planned start and finish date and actual start and end date, the baseline feature helps identify the activity due to which delay occurs, the following are analyzed:
1. Activities which always started late
2. Activities which always finished late
3. Activities which started on time but got delayed
4. Activities which finished on time but started late
5. Activities which started on time and finished on time
6. Activities which started late and finished late
7. Activities which were always getting delayed due to internal activities
8. Activities which were always finished before planned date
9. Activities which were always getting delayed due to external activities
This further helps accurately analyze the reason behind delays like wrong estimation of duration for a task, operator inefficiency, etc.
Conclusion
After successfully pilot testing in one organization, to get feedback from few more organizations, a live demo was organized with 31 merchandisers from five small-scale garment manufacturing organizations from NCR, India. An overwhelming response was received from them as 95 per cent of the merchandisers felt that Gantter’s features are truly relevant and helpful, making their work easy and efficient.
Apart from technical features, Gantter is found to be very effective in T&A planning for SMEs due to free availability, no user limit, no limit of active projects, no storage space limit, Google Drive integration, sync with Google Calendar, and multi-user collaborative scheduling and planning. To compete with the continuous growing global market, it is necessary to adapt to new technologies which are making the manual work easy. Based on a comparative analysis of the time taken to accomplish goals through the new and the earlier methods, Gantter can help determine the effectiveness of new techniques adopted.
Post a Comment